The Visualization Tool
The visualization tool allows you to visualize the results of completed models or visualize the location and flow data of uploaded data files.

Visualize Model Result
To visualize the result of a completed model, use the left-hand side of the visualization tool and select the desired model in the dropdown menu.

After selecting Go, you will then be able to view the model data and the results. You can view the transportation pathways to see the transportation cost and how much product is being transported, and you can view the price gradient resutls.
For more detailed information about using the visualization tool to view model results, see the Interpreting the Results Tutorial
Uploading New Data
If you have geographical data and flow results, you can directly visualize the results without having to run a model. In this section of the tutorial, we will be using example files, which can be found here.
First, select Go to enter the visualization tool. Then, select the Upload Data File button, located at the top of the page.

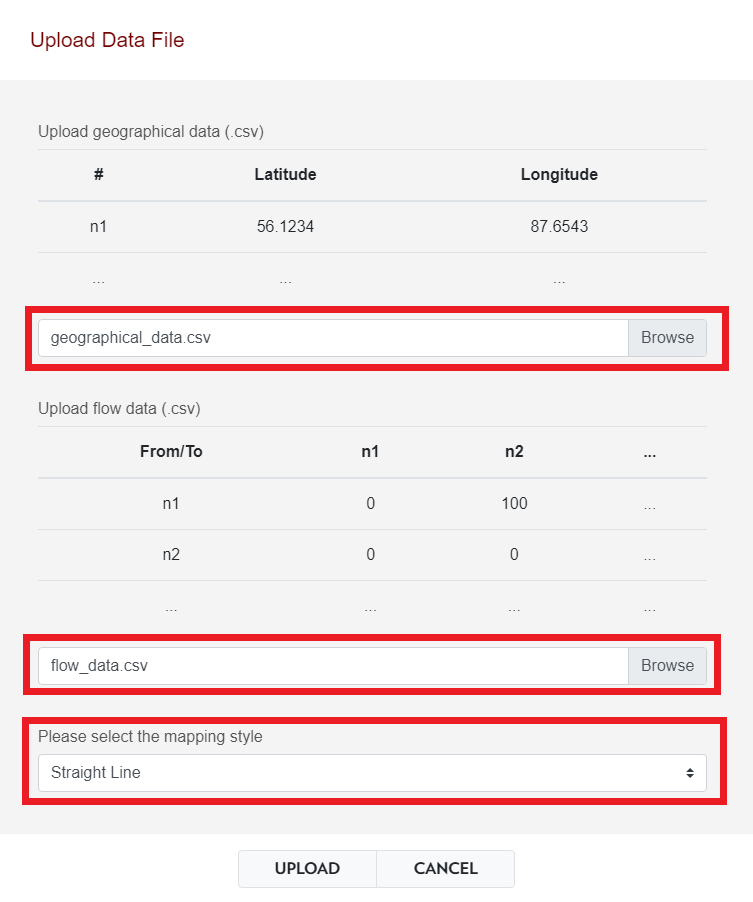
After selecting Upload Data File, you can now upload the data files to the visualization tool and select the desired mapping style.

Straight Line Mapping Style
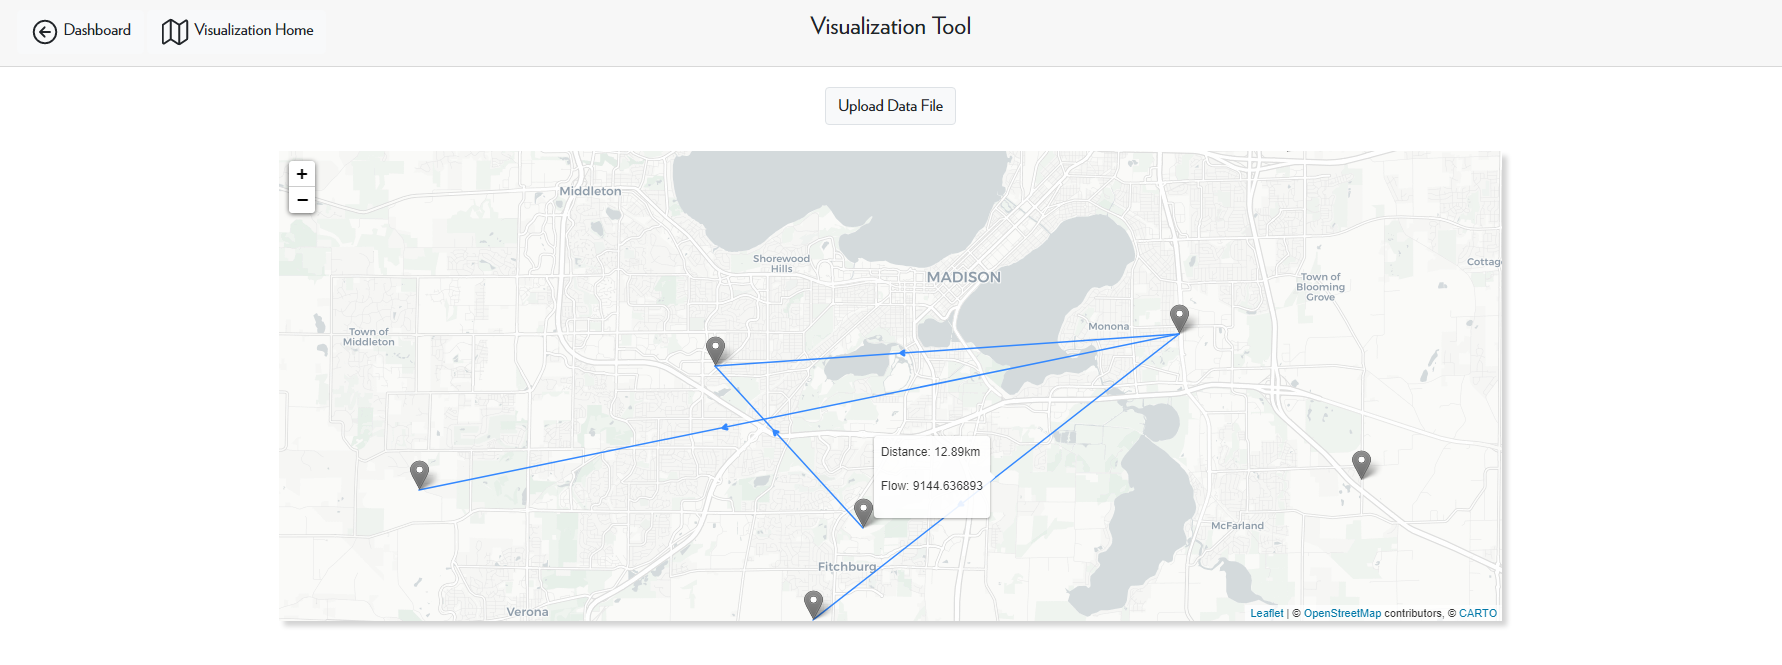
If you select the Straight Line mapping style, the flow data is represented as straight lines from one node to another. You may hover over the lines to display the distance and flow data.

This style of mapping is good when you only want a rough estimate of the flow data.
Routing Mapping Style
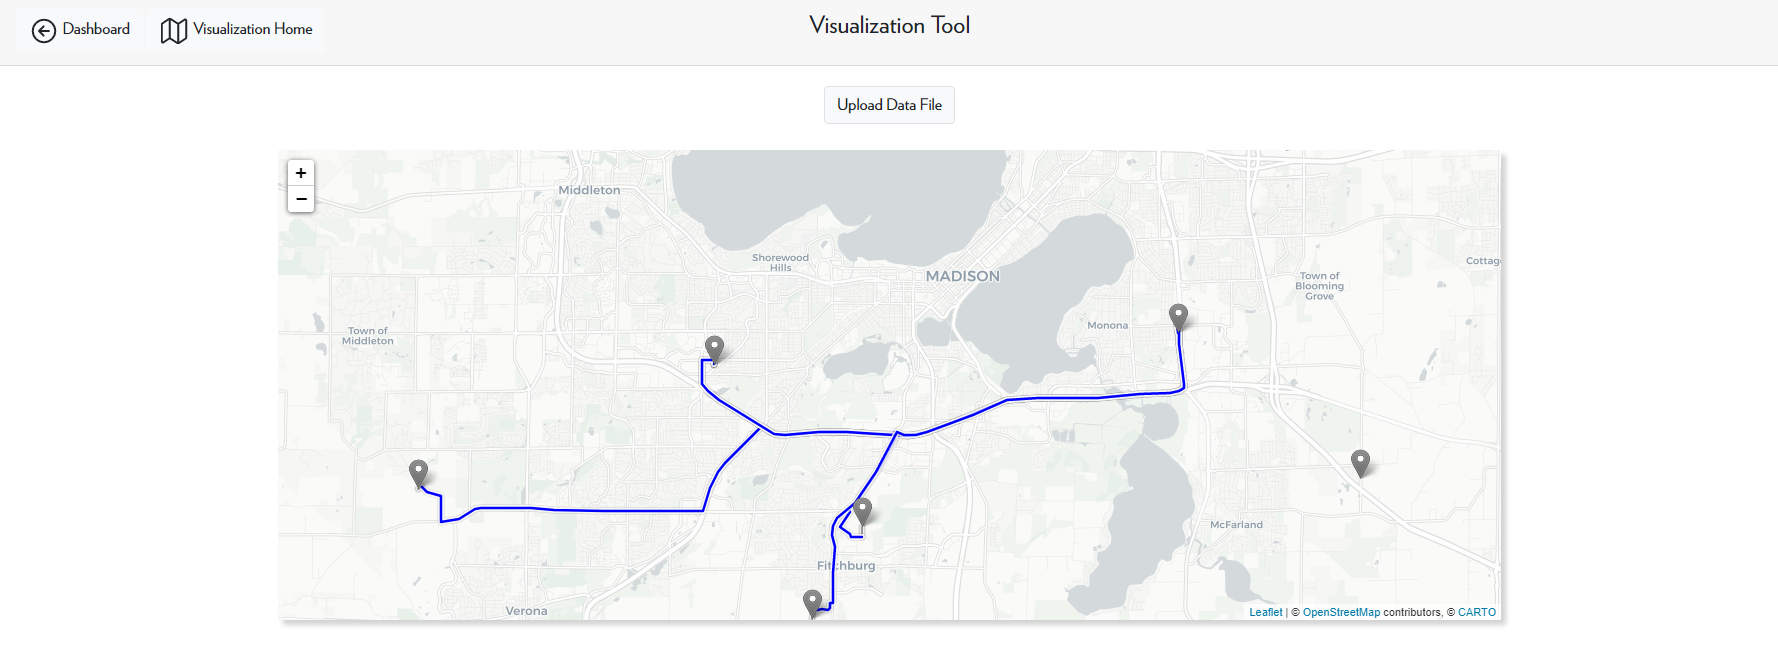
If you select the Routing mapping style, the visualization tool will display the shortest routes that a vehicle will take to get from one node to another. This method of mapping provides a much more accurate view of the transport pathways.

Hybrid Mapping Style
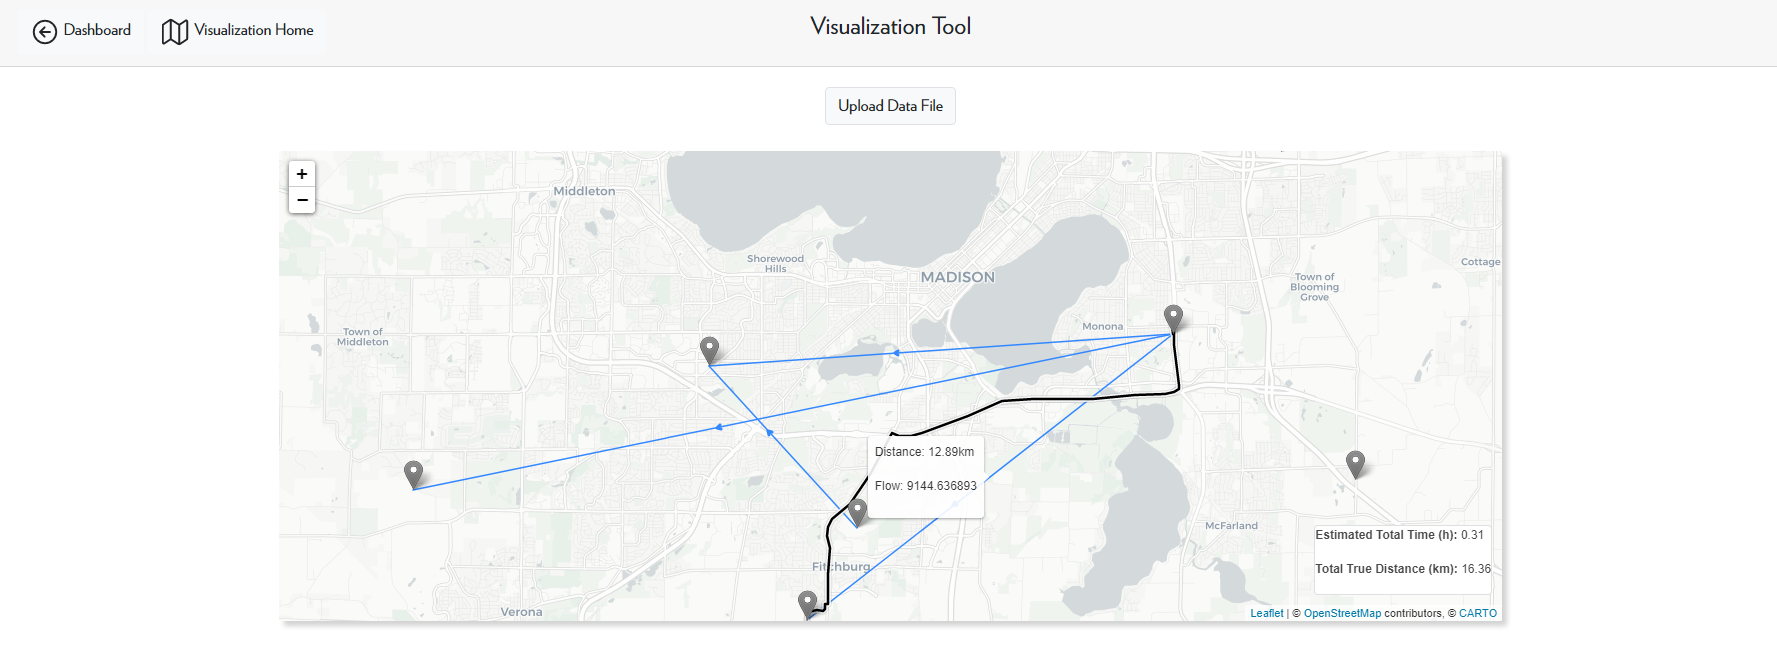
In a hybrid mapping style, the flow pathways are displayed in a Straight Line mapping method, but you can also hover over the straight lines and click in order to display the routing pathways. This method of mapping combines the Straight Line and Hybrid mapping methods, and it displays the most information.
