Nutrient Pollution Control
Background
Nutrient pollution occurs when the runoff from cow manure carries nutrients to a nearby body of water; these nutrients then support harmful algal blooms (HABs). These HABs grow at a rapid, uncontrolled rate and produce toxins that are harmful to humans and wildlife. Not only that, HABs consume a large amount of oxygen when they decay which can suffocate the aquatic life in that body of water.
The Nutrient Pollution Control case study attempts to reduce nutrient runoff by redirecting the nutrients to support crop growth rather than HABs. This is done by processing the waste into phosphorus or pellets, then applying the phosphorus to croplands or selling the pellets to a consumer. However, this process is very expensive so phosphorus incentives are applied. As the price of phosphorus increases, it gets more expensive to buy phosphorus fertilizers. Eventually, the price of using technologies to produce phosphorus becomes cheaper than buying fertilizers.
This case study applies phosphorus incentives of $0, $0.5, $2.5, and $10 per kg P to determine how much waste is processed and how much phosphorus is recovered.
Process Graph
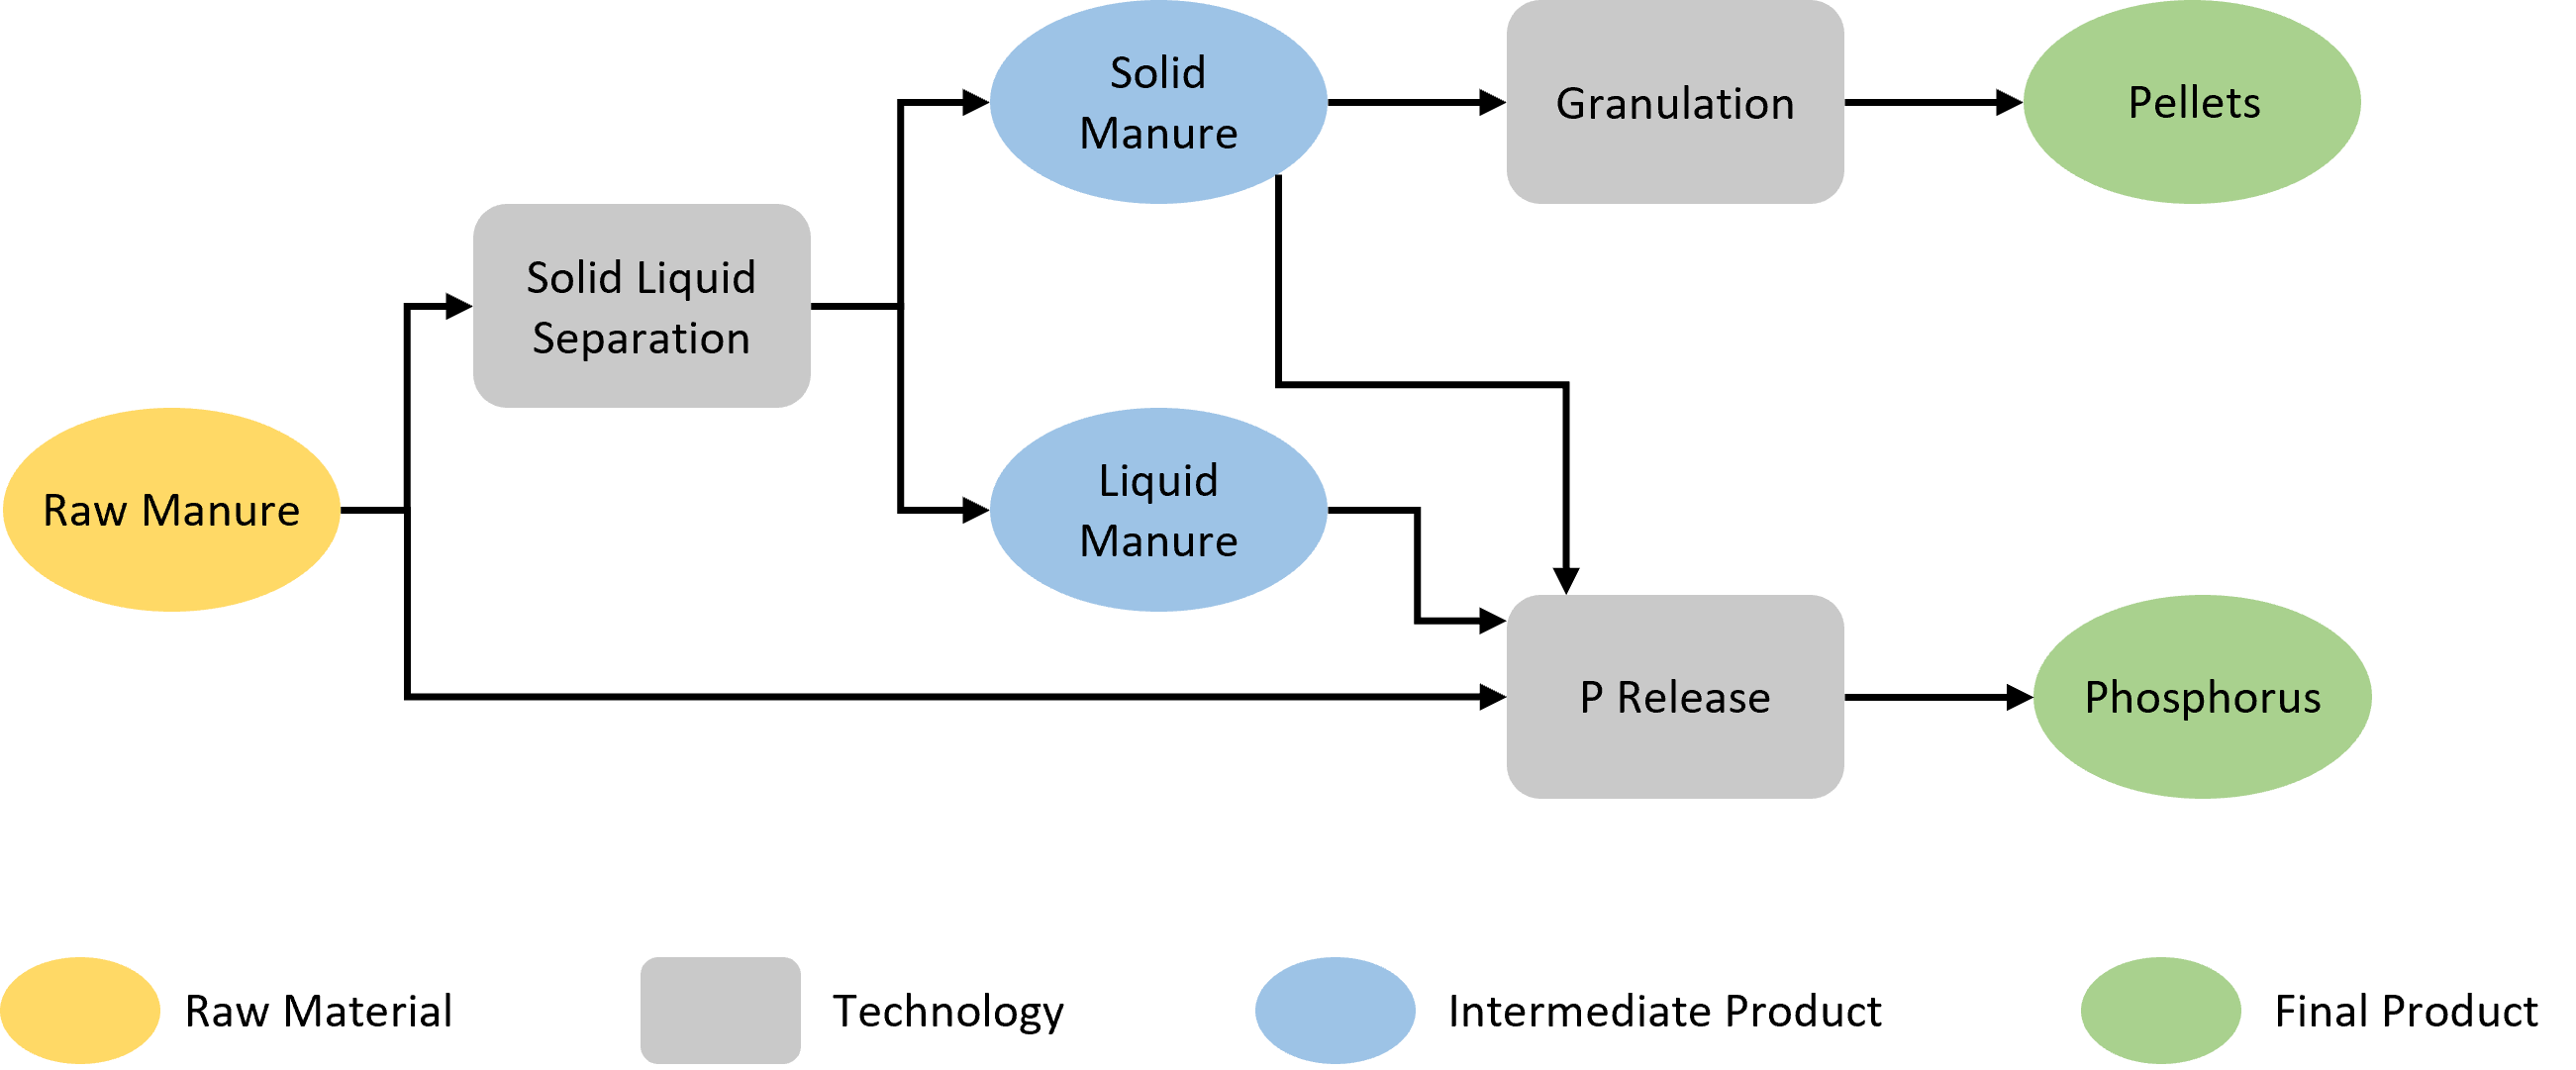
For the Nutrient Pollution Control case study, many products and technologies are interacting with each other. This simplified process graph helps describe the potential products of the supply chain.

In this system, there are three types of technologies: Solid-Liquid Separation (SLS), Granulation, and P Release. SLS technologies take in raw cow manure and separates it into solid and liquid components. Granulation technologies take in the solid component from SLS technology and create pellets that are used as fertilizers. P Release technologies are pseudo technologies that produce phosphorus from raw, solid, or liquid manure. The result of combining these technologies and products into a single diagram that displays all possible supply chain pathways is a process graph.
This allows for a more simplified view of the system when there are many nodes present.
Case 1: $0 USD/kg P
For Case 1, phosphorus is not very profitable, and very little manure is processed. You can tell because most of the transportation lines are red or black which are the raw manure products. The raw manure products are being sent directly to crop fields (indicated by nodes with P Release technologies that demand phosphorus).
Case 2: $0.5 USD/kg P
For Case 2, phosphorus prices are slightly increased and there is not much change to the system. There are a few more red and black transportation lines, but there is still not much waste being processed. Most of the waste is being directly applied to the croplands.
Case 3: $2.5 USD/kg P
For case 3, we begin to see a lot more orange and blue transportation lines. These lines indicate the transportation of solid manure products which are intermediate products resulting from the processing of raw manure through SLS technology.
Case 4: $10 USD/kg P
Case 4 shows even more transportation routes for the various solid and liquid products. Since phosphorus fertilizer prices are increasing, it is more expensive for CAFOs to buy phosphorus fertilizers. They would much rather process their waste at an existing technology site and apply it to crop fields so that they do not have to buy as many phosphorus fertilizers. This will reduce the amount of nutrient pollution that goes into the surrounding lake, and it provides a pathway for waste to be turned into a useful product.
Conclusion
Nutrient pollution caused by cattle waste runoff is damaging to nearby bodies of water, the aquatic life in the water, and small land creatures. In order to reduce nutrient pollution, CAFOs can apply their waste to croplands rather than purchasing phosphorus fertilizers. To encourage CAFOs to use their manure to support their crops, phosphorus incentives are applied.
As a result of this case study, we found that as phosphorus prices increased, more waste would be processed and used as phosphorus-based fertilizers.